An Analogy
Movies have ratings. Your dashboards should too.

i.Expected Audience
ii.Actual Content
The same character. Two entirely different audiences. A rating exists because the gap matters.
Most analytics fail not because the data is wrong, but because every audience receives the same view. Parallax Studio builds visual analytics that adapt to the person reading them — the analyst, the expert, the executive, the operator — without fragmenting the truth underneath.
Visual analytics fail at the seam between technical correctness and audience fit. A single dashboard tries to serve every reader at once — and serves none of them well.
The conventional response is to build more dashboards. More variations. More copies of the same underlying data, drifting apart over time, defended by separate owners, defying any single source of truth.
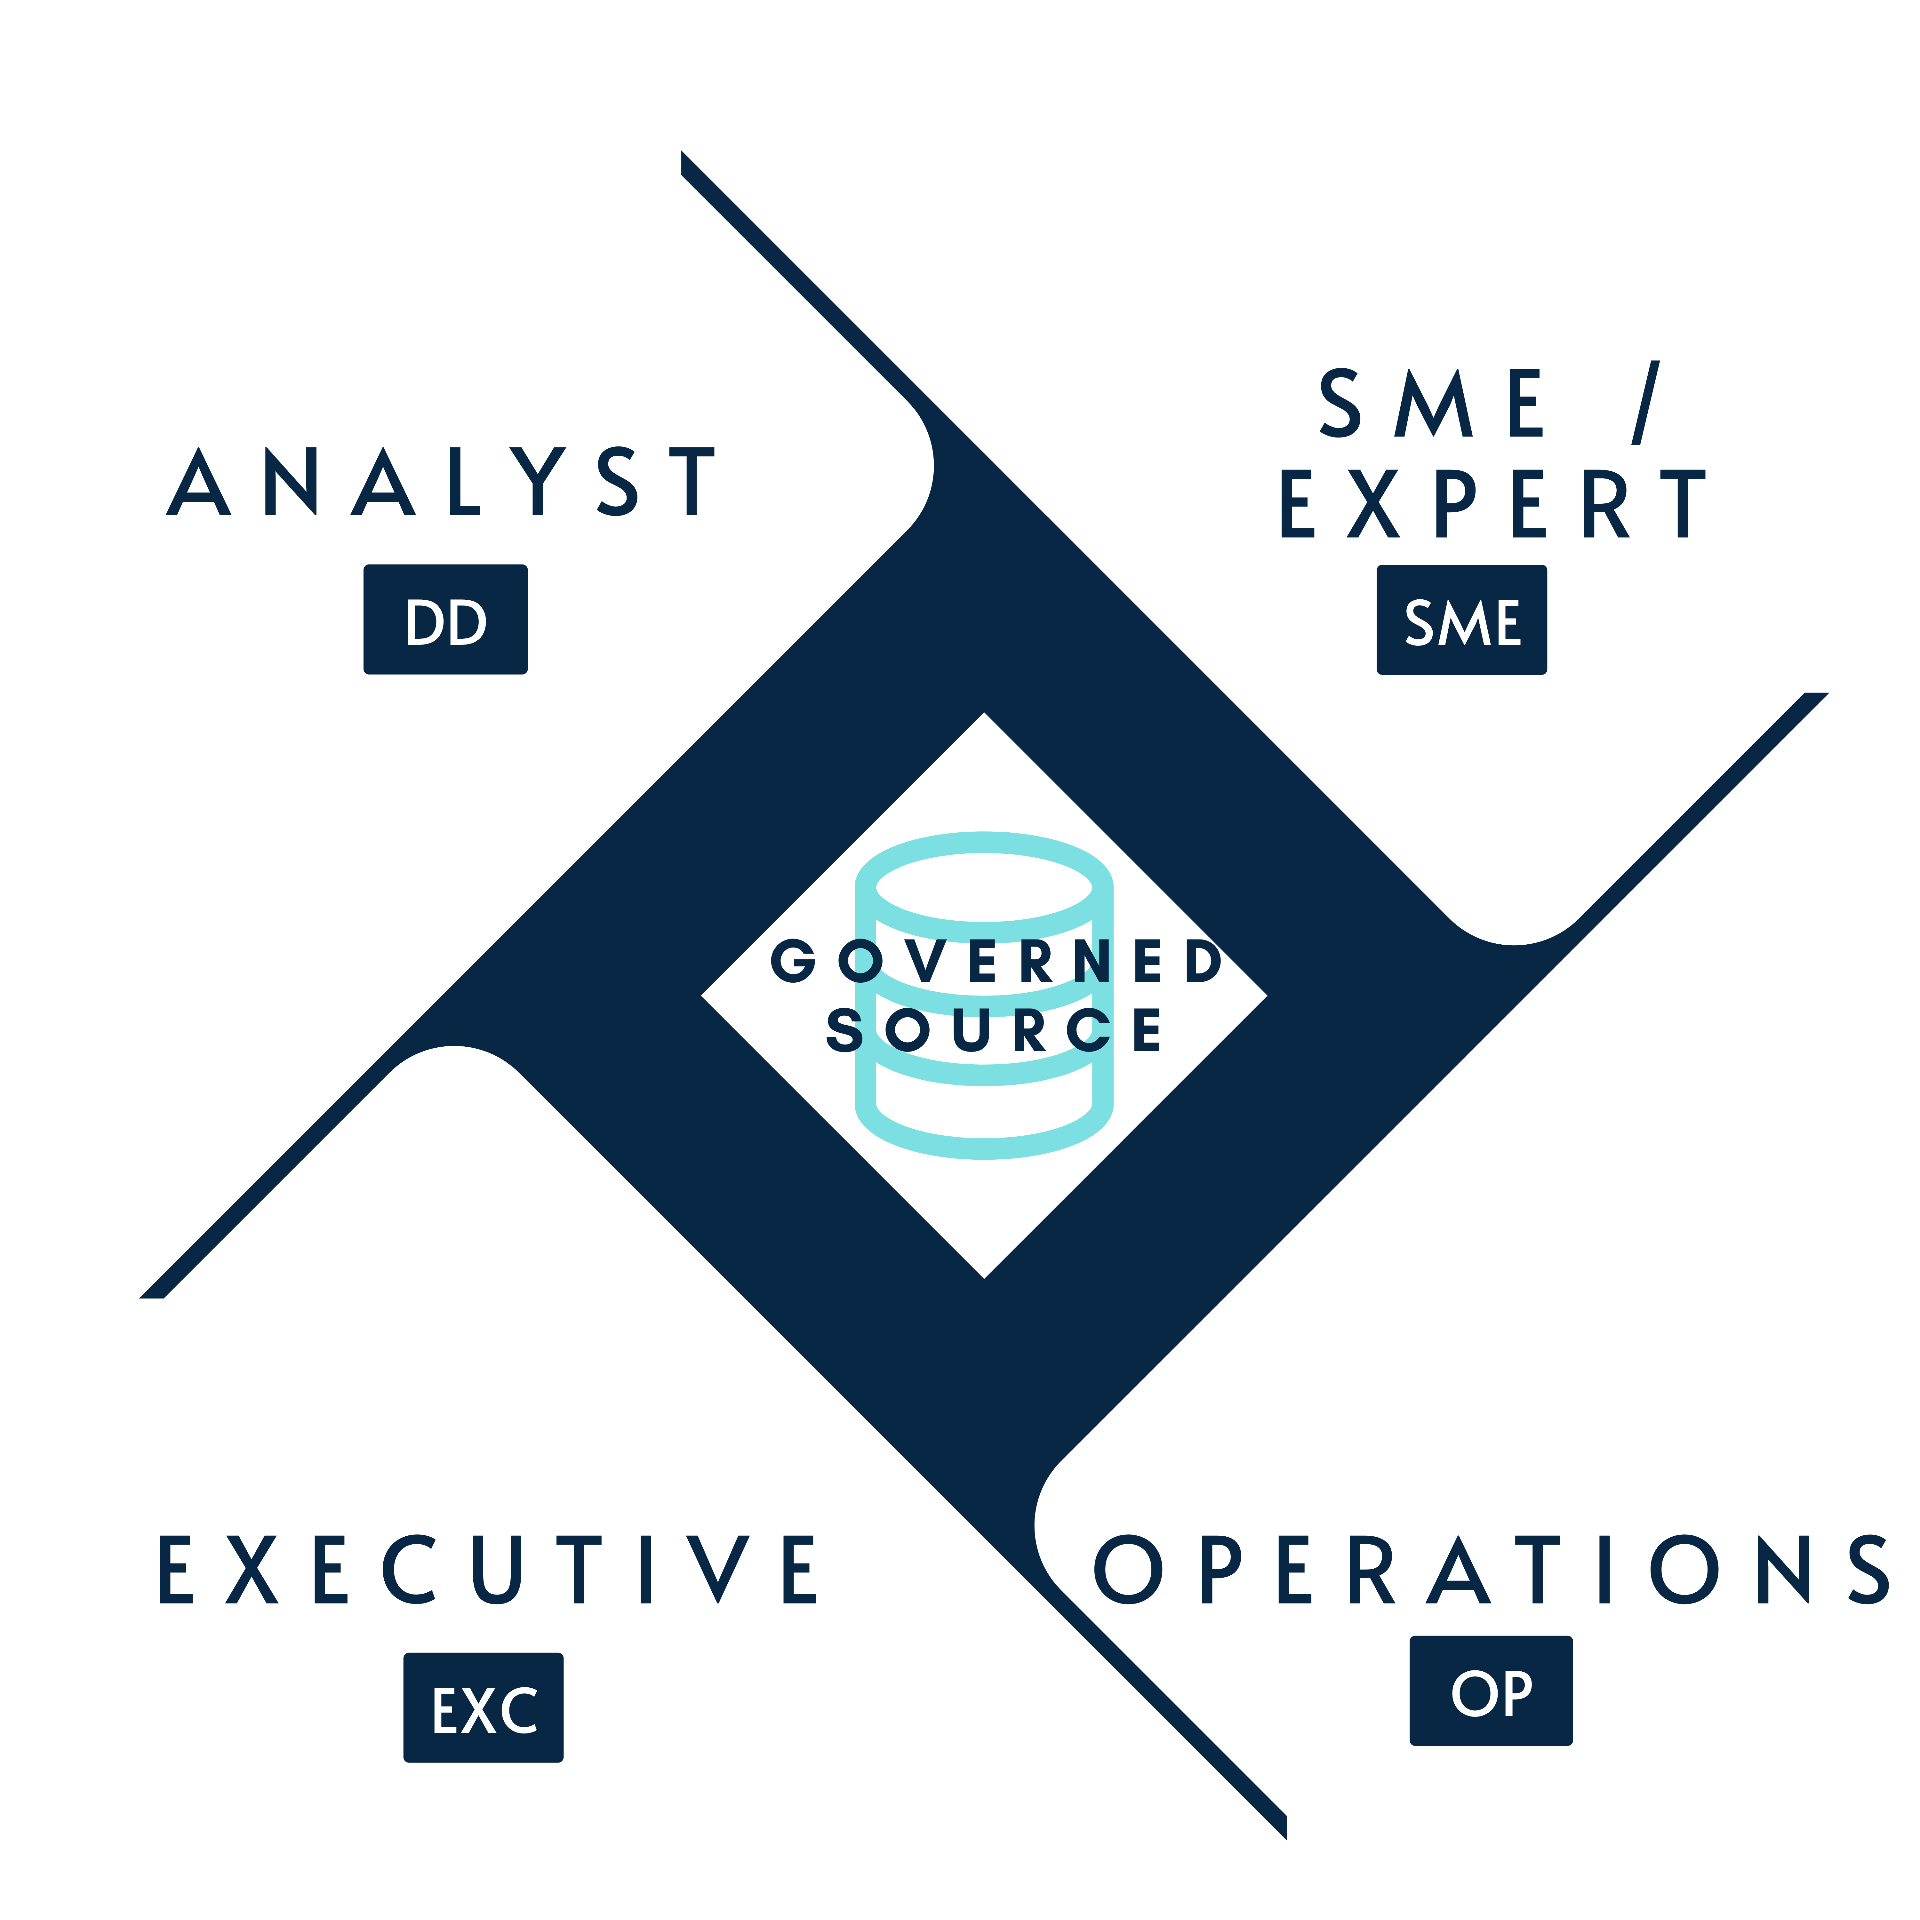
Parallax Studio's response is different: one governed source, four deliberate views. Each view is engineered for a specific audience's decision pattern, cognitive load, and time horizon. The data underneath is shared. The presentation is tailored.
Four lenses — Analyst, Expert, Executive, Operations — each drawn from a single governed dataset. Perspectives™ sits above your data infrastructure (Snowflake, Databricks, SQL Server) and your governance tooling (Collibra, Alation): the layer where the data meets the people.
It's tool-agnostic — the same governed source renders in Tableau, Power BI, or any modern BI stack. The methodology is the proprietary asset.
Each lens is a deliberately shaped view of the same governed dataset. Calibrated to a specific reader, a specific decision, and a specific time horizon.
Switching lenses doesn't fork the data. It reframes it.
Built for the person who needs to interrogate the data — to follow the thread, isolate the cohort, prove or disprove the hypothesis. Maximum dimensionality, exposed filters, drill paths to the underlying record.
Built for the subject-matter expert who reads the data through years of pattern recognition. Highlights the patterns that a domain expert is skilled at identifying. Calibrated to support judgment, not replace it.
Built for the reader who has thirty seconds. Answers the question before it is asked. Zero clicks to the headline number, zero ambiguity about whether the news is good.
Built for the people who run the work — the queue, the throughput, the exception list. Refreshes often, surfaces the action, never asks the reader to interpret status.
Every Parallax Studio engagement moves through four stages. The deliverables are real — not slideware, not recommendations, but production-ready visual analytics governed by the Perspectives™ framework.
Parallax Studio is built around domains where dashboards influence decisions that matter — patient outcomes, public funds, program performance, community trust.
A beautiful dashboard for the wrong reader is a failed dashboard. Every visual decision begins with the person on the receiving end.
Multiple views are fine. Multiple truths are not. Every Perspectives™ deployment is anchored in a single, documented, owned data source.
Some readers want everything. Others want one number. The lens decides; the data does not push uniform density onto every viewer.
We don't ship drafts. The artifact you receive is the artifact your stakeholders see — engineered, documented, and standards-enforced.
Perspectives™ lives above your stack. We do not sell the warehouse, the governance tool, or the BI license. We sell the methodology.
A successful handoff means your team carries the work forward without us. The framework is documented to be inherited, not hoarded.
The first conversation is a scoping discussion — no pitch, no proposal. We listen, ask about the data and the audiences, and tell you honestly whether Perspectives™ is the right fit for the work you're describing.
If it is, we'll propose a structured engagement. If it isn't, we'll tell you that too — and where appropriate, suggest who might be a better match.