One inventory. One Enterprise Data Inventory, 2,633 datasets, one set of governed fields. The temptation is to read it once and file the headline — 87% published, 87% active, looks fine — and move on. But a catalog answers a different question depending on who is asking it. Browse it as a resident and it looks abundant. Read it as an executive and the risk is concentrated. Audit it as an operator and most of it isn’t yet reachable. Trace one field as a subject-matter expert and the word “published” turns out to mean something other than what a resident would assume. Same source. Four lenses. Four true answers.
What’s in the catalog?
The browse lens is the resident’s door in: 2,633 datasets across 25 categories and 73 agencies, filterable by type, sensitivity, and source. At first read it is a broad, well-tagged inventory. Sensitivity skews toward N/A (54%) and PII (31%); the listing is searchable and complete.
Nothing here raises an alarm — which is exactly why it shouldn’t be the only view anyone sees. Discovery tells you the catalog exists and is organized. It does not tell you whether it is maintained, where the risk sits, or whether a resident could actually open any given row.

Where is the risk?
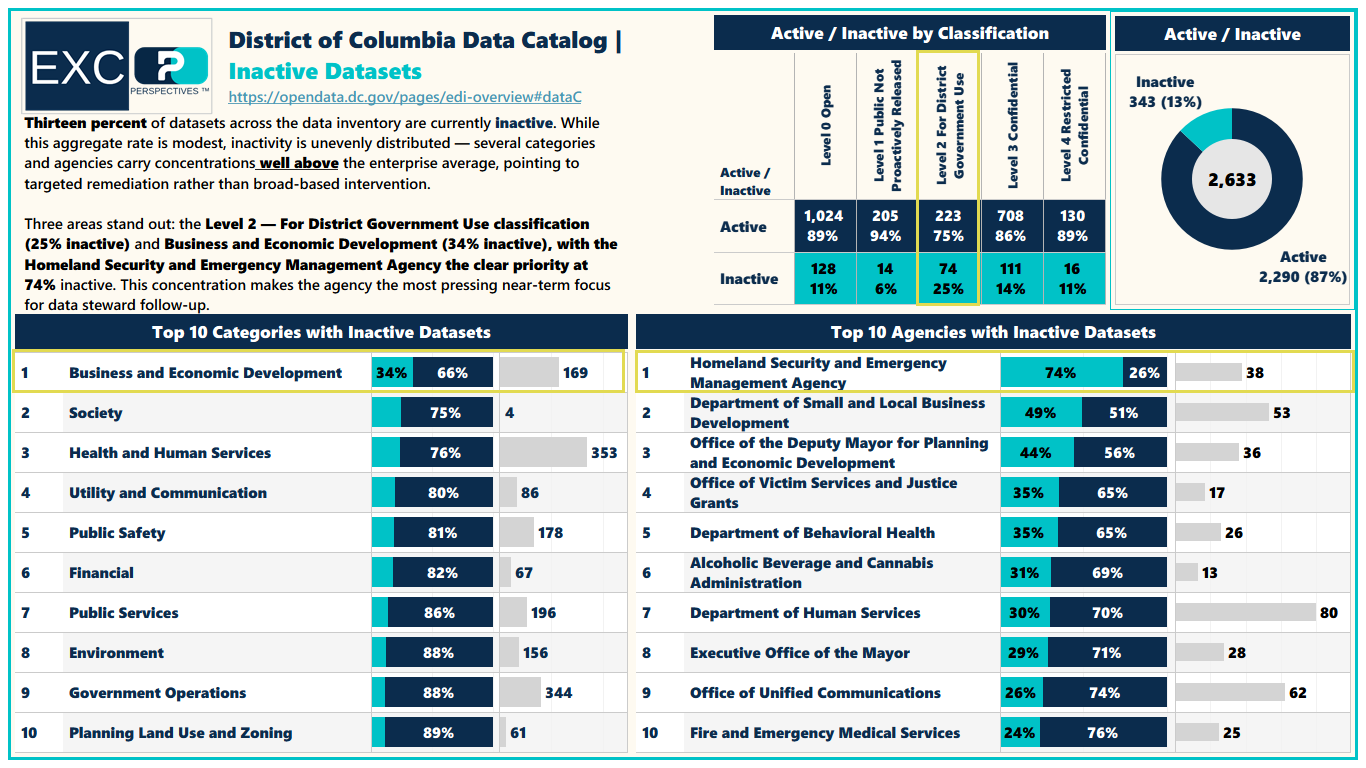
Shift to the executive lens and the aggregate calms before it concentrates. 13% of the inventory is inactive — modest on its own, but unevenly distributed. A handful of categories and agencies carry concentrations well above the enterprise average, which points to targeted remediation rather than broad-based intervention.
Two areas stand out: the Level 2 — For District Government Use classification (25% inactive) and Business and Economic Development (34% inactive). The clear priority is the Homeland Security and Emergency Management Agency at 74% inactive — the most pressing near-term focus for a data steward.
Is it being maintained?
The operator’s lens scores the inventory on its own terms. Across the 2,633 datasets, average metadata completeness lands at 61.4% — measured against description, sensitivity, URL, open-data status, and disposal reason. The score is dynamic: a record is never penalized for a field that doesn’t apply to it, so an active dataset isn’t marked down for lacking a disposal reason.
The gap that jumps out is reach. Only about 7% of records carry a URL. The inventory is, in other words, thoroughly described — and not yet thoroughly reachable. That distinction is invisible from the discovery lens and sets up the fourth.

What does “published” actually mean?
The fourth lens follows one field to its conclusion. By Publication Status, 2,294 datasets are Published (87%) and 339 are Audit Completed (13%). Read quickly, “Published” sounds like “live on the public open-data portal.” Cross it against Is on DC.gov? and the two come apart.
Of all 2,633 datasets, only 153 (6%) are on the open-data portal. “Published” is an internal lifecycle state — the dataset has cleared its workflow — not a statement that a resident can find it on DC.gov. The same inventory is 87% published and 6% public. Both figures are correct. Only the fourth lens shows you they are answering different questions.


